THE CONCEPT OF MAN-MADE GLOBAL WARMING IS DESIGNED TO DESTROY WESTERN CIVILIZATION
Green Energy

THE CONCEPT OF MAN-MADE GLOBAL WARMING IS DESIGNED TO DESTROY WESTERN CIVILIZATION


... JUST AS SURE AT JIHADISM IS DESIGNED TO DESTROY INFIDELS.

All of you, do yourselves a favor, and stop believing in this Leftist bullshit.

1998 no longer the hottest year on record in USA

Here's a story of scientific investigation and discovery I'm proud to have had a small part in. Regular readers may remember that I posted about a climate station in Detroit Lakes MN last week, surveyed by volunteer Don Kostuch, and cross posted it to the website http://www.climateaudit.org/?p=1828#comments that had two air conditioner units right next to it. It looked like an obvious cause and effect because in 1999 on May 5th, it was determined that the a/c units were moved off the roof of the radio station where this station resides and moved them to the ground where the temperature sensor is close by.
Detroit_lakes_USHCN.jpg
Detroit Lakes, MN surveyed by Don Kostuch - Don has single handedly done almost the entire state of Minnesota!
However, some folks on the blogosphere just went, well, a little ballistic over that assertion. It was a good thing too, because their very loud and somewhat uncivil complaints led to an examination of this idea: if its not the a/c units, what then did cause the temperature jump at that time?
Detroit_lakes_GISSplot.jpg
Steve McIntyre, of Toronto operates www.climateaudit.org and began to investigate the data and the methods used to arrive at the results that were graphed by NASA's Goddard Institute for Space Studies (GISS).
What he discovered was truly amazing. Since NASA does not fully publish the computer source code and formulae used to calculate the trends in the graph, nor the correction used to arrive at the "corrected" data. He had to reverse engineer the process by comparing the raw data and the processed data..
Here is one of his first posts where he begins to understand what is happening. "This imparts an upward discontinuity of a deg C in wintertime and 0.8 deg C annually. I checked the monthly data and determined that the discontinuity occurred on January 2000 - and, to that extent, appears to be a Y2K problem. I presume that this is a programming error."
He further refines his argument showing the distribution of the error, and the problems with the USHCN temperature data. He also sends an email to NASA GISS advising of the problem.
He finally publishes it here, stating that NASA made a correction not only on their own web page, attributing the discovery to McIntyre, but NASA also issued a corrected set of temperature anomaly data which you can see here:
http://data.giss.nasa.gov/gistemp/graphs/Fig.D.txt
Steve McIntyre posted this data from NASA's newly published data set from Goddard Institute of Space Studies (GISS) These numbers represent deviation from the mean temperature calculated from temperature measurement stations throughout the USA.
According to the new data published by NASA, 1998 is no longer the hottest year ever. 1934 is.
Four of the top 10 years of US CONUS high temperature deviations are now from the 1930s: 1934, 1931, 1938 and 1939, while only 3 of the top 10 are from the last 10 years (1998, 2006, 1999). Several years (2000, 2002, 2003, 2004) fell well down the leaderboard, behind even 1900. (World rankings of temperature are calculated separately.)
Top 10 GISS U.S. Temperature deviation (deg C) in New Order 8/7/2007
YearOldNew
19341.231.25
19981.241.23
19211.121.15
20061.231.13
19311.081.08
19990.940.93
19530.910.90
19900.880.87
19380.850.86
19390.840.85
Here’s the old order of top 10 yearly temperatures.
YearOldNew
19981.241.23
19341.231.25
20061.231.13
19211.121.15
19311.081.08
19990.940.93
19530.910.90
20010.900.76
19900.880.87
19380.850.86
I salute the work of Steven McIntyre, he has now made two major contributions to climate science.
1) Proving how the Mann "hockey stick" used in all Gore's movie, An Inconvenient Truth, was based on unsupportable data and methods.
2) Proving how yearly temperature anomalies for the USA are based on data that had been processed incorrectly.
Dr. Roger Pielke of the University of Colorado also deserves credit becuase he was the one who encouraged me to pursue the www.surfacestations.orgproject due to his broad work on land use change and it's affect on regional and local climate.
Massive scientific fraud: Blatant and grossly deceptive data selection ("cherrypicking") by Warmist "scientists"
These guys would not make a real scientist's a**hole. They were pretending to use tree-ring data to create a picture of the climate before thermometers were invented. And they claimed that their data showed no Medieval warm period but record warming in the late 20th century. And their data did exactly that. But how did they get their data? By ignoring a whole heap of data and just picking out a tiny subset of trees that suited their preconceptions. And if you use ALL the tree-ring data, you get totally opposite results. See the divergence in the graph below. Following the graph is a summary of the huge battle skeptical scientists had in order to get the raw data concerned. The Warmists knew that they had committed a repeated fraud and did their damndest to cover it up. Scientific fraud is a serious matter. They should lose their jobs.


Here’s a re-cap of this saga that should make clear the stunning importance of what Steve has found. One point of terminology: a tree ring record from a site is called a chronology, and is made up of tree ring records from individual trees at that site. Multiple tree ring series are combined using standard statistical algorithms that involve detrending and averaging (these methods are not at issue in this thread). A good chronology–good enough for research that is–should have at least 10 trees in it, and typically has much more.

1. In a 1995 Nature paper by Briffa, Schweingruber et al., they reported that 1032 was the coldest year of the millennium – right in the middle of the Medieval Warm Period. But the reconstruction depended on 3 short tree ring cores from the Polar Urals whose dating was very problematic. http://www.climateaudit.org/?p=877.

2. In the 1990s, Schweingruber obtained new Polar Urals data with more securely-dated cores for the MWP. Neither Briffa nor Schweingruber published a new Polar Urals chronology using this data. An updated chronology with this data would have yielded a very different picture, namely a warm medieval era and no anomalous 20th century. Rather than using the updated Polar Urals series, Briffa calculated a new chronology from Yamal – one which had an enormous hockey stick shape. After its publication, in virtually every study, Hockey Team members dropped Polar Urals altogether and substituted Briffa’s Yamal series in its place.
http://www.climateaudit.org/?p=528. PS: The exception to this pattern was Esper et al (Science) 2002, which used the combined Polar Urals data. But Esper refused to provide his data. Steve got it in 2006 after extensive quasi-litigation with Science (over 30 email requests and demands).

3. Subsequently, countless studies appeared from the Team that not only used the Yamal data in place of the Polar Urals, but where Yamal had a critical impact on the relative ranking of the 20th century versus the medieval era.
http://www.climateaudit.org/?p=3099

4. Meanwhile Briffa repeatedly refused to release the Yamal measurement data used inhis calculation despite multiple uses of this series at journals that claimed to require data archiving. E.g. http://www.climateaudit.org/?p=542

5. Then one day Briffa et al. published a paper in 2008 using the Yamal series, again without archiving it. However they published in a Phil Tran Royal Soc journal which has strict data sharing rules. Steve got on the case. http://www.climateaudit.org/?p=3266

6. A short time ago, with the help of the journal editors, the data was pried loose and appeared at the CRU web site. http://www.climateaudit.org/?p=7142

7. It turns out that the late 20th century in the Yamal series has only 10 tree ring chronologies after 1990 (5 after 1995), making it too thin a sample to use (according to conventional rules). But the real problem wasn’t that there were only 5-10 late 20th century cores- there must have been a lot more. They were only using a subset of 10 cores as of 1990, but there was no reason to use a small subset. (Had these been randomly selected, this would be a thin sample, but perhaps passable. But it appears that they weren’t randomly selected.)
http://www.climateaudit.org/?p=7142

8. Faced with a sample in the Taymir chronology that likely had 3-4 times as many series as the Yamal chronology, Briffa added in data from other researchers’ samples taken at the Avam site, some 400 km away. He also used data from the Schweingruber sampling program circa 1990, also taken about 400 km from Taymir. Regardless of the merits or otherwise of pooling samples from such disparate locations, this establishes a precedent where Briffa added a Schweingruber site to provide additional samples. This, incidentally, ramped up the hockey-stickness of the (now Avam-) Taymir chronology.
http://www.climateaudit.org/?p=7158

9. Steve thus looked for data from other samples at or near the Yamal site that could have been used to increase the sample size in the Briffa Yamal chronology. He quickly discovered a large set of 34 Schweingruber samples from living trees. Using these instead of the 12 trees in the Briffa (CRU) group that extend to the present yields Figure 2, showing a complete divergence in the 20th century. Thus the Schweingruber data completely contradicts the CRU series. Bear in mind the close collaboration of Schweingruber and Briffa all this time, and their habit of using one another’s data as needed.

10. Combining the CRU and Schweingruber data yields the green line in the 3rd figure above. While it doesn’t go down at the end, neither does it go up, and it yields a medieval era warmer than the present, on the standard interpretation. Thus the key ingredient in a lot of the studies that have been invoked to support the Hockey Stick, namely the Briffa Yamal series (red line above) depends on the influence of a thin subsample of post-1990 chronologies and the exclusion of the (much larger) collection of readily-available Schweingruber data for the same area.

More HERE

Posted by John Ray (M.A.; Ph.D.). For a daily critique of Leftist activities, see DISSECTING LEFTISM. To keep up with attacks on free speech seeTONGUE-TIED. Also, don't forget your daily roundup of pro-environment but anti-Greenie news and commentary at GREENIE WATCH . Email me (John Ray) here

Tuesday, September 22, 2009

NYTIMES: "global temperatures have been stable for a decade and may even drop in the next few years."
N YTIMES (VIA JH):
global temperatures have been stable for a decade and may even drop in the next few years.

Monday, January 19, 2009

A FEW DOZEN QUOTES FROM SCIENTISTS WHO THINK AGW IS BS
MORE AND MORE SCIENTISTS ARE COMING OUT ASND PROCLAIMING THAT ANTHRPOGENIC CLIMATE CHANGE IS BULLSHIT.

YOU CAN READ SHORT QUOTES FROM A FEW DOZEN OF THEM HERE.

EXCERPTS: “But there is no falsifiable scientific basis whatever to assert this warming is caused by human-produced greenhouse gasses because current physical theory is too grossly inadequate to establish any cause at all.”

- Chemist Dr. Patrick Frank, who has authored more than 50 peer-reviewed articles.


“The ‘global warming scare’ is being used as a political tool to increase government control over American lives, incomes and decision making. It has no place in the Society's activities.”

- Award-Winning NASA Astronaut/Geologist and Moonwalker Jack Schmitt who flew on the Apollo 17 mission and formerly of the Norwegian Geological Survey and for the U.S. Geological Survey.


“Earth has cooled since 1998 in defiance of the predictions by the UN-IPCC….The global temperature for 2007 was the coldest in a decade and the coldest of the millennium…which is why ‘global warming’ is now called ‘climate change.’”

- Climatologist Dr. Richard Keen of the Department of Atmospheric and Oceanic Sciences at the University of Colorado.


“I have yet to see credible proof of carbon dioxide driving climate change, yet alone man-made CO2 driving it. The atmospheric hot-spot is missing and the ice core data refute this. When will we collectively awake from this deceptive delusion?”

- Dr. G LeBlanc Smith, a retired Principal Research Scientist with Australia’s CSIRO

“The quantity of CO2 we produce is insignificant in terms of the natural circulation between air, water and soil... I am doing a detailed assessment of the UN IPCC reports and the Summaries for Policy Makers, identifying the way in which the Summaries have distorted the science.”


- South Afican Nuclear Physicist and Chemical Engineer Dr. Philip Lloyd, a UN IPCC co-coordinating lead author who has authored over 150 refereed publications.

“Many [scientists] are now searching for a way to back out quietly ( from promoting warming fears ), without having their professional careers ruined.”

- Atmospheric physicist James A. Peden, formerly of the Space Research and Coordination Center in Pittsburgh.

“All those urging action to curb global warming need to take off the blinkers and give some thought to what we should do if we are facing global cooling instead.”

- Geophysicist Dr. Phil Chapman, an astronautical engineer and former NASA astronaut, served as staff physicist at MIT ( Massachusetts Institute of Technology )

“Creating an ideology pegged to carbon dioxide is a dangerous nonsense…The present alarm on climate change is an instrument of social control, a pretext for major businesses and political battle. It became an ideology, which is concerning.”

- Environmental Scientist Professor Delgado Domingos of Portugal, the founder of the Numerical Weather Forecast group, has more than 150 published articles.


“CO2 emissions make absolutely no difference one way or another….Every scientist knows this, but it doesn’t pay to say so…Global warming, as a political vehicle, keeps Europeans in the driver’s seat and developing nations walking barefoot.”

- Dr. Takeda Kunihiko, vice-chancellor of the Institute of Science and Technology Research at Chubu University in Japan.

“The [global warming] scaremongering has its justification in the fact that it is something that generates funds.”

- Award-winning Paleontologist Dr. Eduardo Tonni, of the Committee for Scientific Research in Buenos Aires and head of the Paleontology Department at the University of La Plata.

“Whatever the weather, it's not being caused by global warming. If anything, the climate may be starting into a cooling period.”

- Atmospheric scientist Dr. Art V. Douglas, former Chair of the Atmospheric Sciences Department at Creighton University in Omaha, Nebraska, and is the author of numerous papers for peer-reviewed publications.

Friday, July 18, 2008

GREENHOUSE AUSTRALIA
Now that Australia's new centre-Left Prime Minister is has pushed climate policy to the top of the national agenda as a convenient mask for his lack of any new ideas, the debate over "Greenhouse" is very lively in Australia. And, thanks to the Murdoch press, skeptical viewpoints are occasionally getting a good airing. The two articles on the subject reproduced below are particularly powerful

Top Australian Greenhouse expert now a skeptic

By David Evans

I DEVOTED six years to carbon accounting, building models for the Australian Greenhouse Office. I am the rocket scientist who wrote the carbon accounting model (FullCAM) that measures Australia's compliance with the Kyoto Protocol, in the land use change and forestry sector. FullCAM models carbon flows in plants, mulch, debris, soils and agricultural products, using inputs such as climate data, plant physiology and satellite data. I've been following the global warming debate closely for years.

When I started that job in 1999 the evidence that carbon emissions caused global warming seemed pretty good: CO2 is a greenhouse gas, the old ice core data, no other suspects. The evidence was not conclusive, but why wait until we were certain when it appeared we needed to act quickly? Soon government and the scientific community were working together and lots of science research jobs were created. We scientists had political support, the ear of government, big budgets, and we felt fairly important and useful (well, I did anyway). It was great. We were working to save the planet.

But since 1999 new evidence has seriously weakened the case that carbon emissions are the main cause of global warming, and by 2007 the evidence was pretty conclusive that carbon played only a minor role and was not the main cause of the recent global warming. As Lord Keynes famously said, "When the facts change, I change my mind. What do you do, sir?" There has not been a public debate about the causes of global warming and most of the public and our decision makers are not aware of the most basic salient facts:

1. The greenhouse signature is missing. We have been looking and measuring for years, and cannot find it. Each possible cause of global warming has a different pattern of where in the planet the warming occurs first and the most. The signature of an increased greenhouse effect is a hot spot about 10km up in the atmosphere over the tropics. We have been measuring the atmosphere for decades using radiosondes: weather balloons with thermometers that radio back the temperature as the balloon ascends through the atmosphere. They show no hot spot. Whatsoever. If there is no hot spot then an increased greenhouse effect is not the cause of global warming. So we know for sure that carbon emissions are not a significant cause of the global warming. If we had found the greenhouse signature then I would be an alarmist again.

When the signature was found to be missing in 2007 (after the latest IPCC report), alarmists objected that maybe the readings of the radiosonde thermometers might not be accurate and maybe the hot spot was there but had gone undetected. Yet hundreds of radiosondes have given the same answer, so statistically it is not possible that they missed the hot spot. Recently the alarmists have suggested we ignore the radiosonde thermometers, but instead take the radiosonde wind measurements, apply a theory about wind shear, and run the results through their computers to estimate the temperatures. They then say that the results show that we cannot rule out the presence of a hot spot. If you believe that you'd believe anything.

2. There is no evidence to support the idea that carbon emissions cause significant global warming. None. There is plenty of evidence that global warming has occurred, and theory suggests that carbon emissions should raise temperatures (though by how much is hotly disputed) but there are no observations by anyone that implicate carbon emissions as a significant cause of the recent global warming.

3. The satellites that measure the world's temperature all say that the warming trend ended in 2001, and that the temperature has dropped about 0.6C in the past year (to the temperature of 1980). Land-based temperature readings are corrupted by the "urban heat island" effect: urban areas encroaching on thermometer stations warm the micro-climate around the thermometer, due to vegetation changes, concrete, cars, houses. Satellite data is the only temperature data we can trust, but it only goes back to 1979. NASA reports only land-based data, and reports a modest warming trend and recent cooling. The other three global temperature records use a mix of satellite and land measurements, or satellite only, and they all show no warming since 2001 and a recent cooling.

4. The new ice cores show that in the past six global warmings over the past half a million years, the temperature rises occurred on average 800 years before the accompanying rise in atmospheric carbon. Which says something important about which was cause and which was effect.

None of these points are controversial. The alarmist scientists agree with them, though they would dispute their relevance. The last point was known and past dispute by 2003, yet Al Gore made his movie in 2005 and presented the ice cores as the sole reason for believing that carbon emissions cause global warming. In any other political context our cynical and experienced press corps would surely have called this dishonest and widely questioned the politician's assertion.

Until now the global warming debate has merely been an academic matter of little interest. Now that it matters, we should debate the causes of global warming. So far that debate has just consisted of a simple sleight of hand: show evidence of global warming, and while the audience is stunned at the implications, simply assert that it is due to carbon emissions. In the minds of the audience, the evidence that global warming has occurred becomes conflated with the alleged cause, and the audience hasn't noticed that the cause was merely asserted, not proved. If there really was any evidence that carbon emissions caused global warming, don't you think we would have heard all about it ad nauseam by now?

The world has spent $50 billion on global warming since 1990, and we have not found any actual evidence that carbon emissions cause global warming. Evidence consists of observations made by someone at some time that supports the idea that carbon emissions cause global warming. Computer models and theoretical calculations are not evidence, they are just theory.

What is going to happen over the next decade as global temperatures continue not to rise? The Labor Government is about to deliberately wreck the economy in order to reduce carbon emissions. If the reasons later turn out to be bogus, the electorate is not going to re-elect a Labor government for a long time. When it comes to light that the carbon scare was known to be bogus in 2008, the ALP is going to be regarded as criminally negligent or ideologically stupid for not having seen through it. And if the Liberals support the general thrust of their actions, they will be seen likewise.

The onus should be on those who want to change things to provide evidence for why the changes are necessary. The Australian public is eventually going to have to be told the evidence anyway, so it might as well be told before wrecking the economy.

Source


Evidence doesn't bear out alarmist claims of global warming

Andrew Bolt tells Kevin Rudd stuff the Ruddy one does not want to hear. No Leftist wants to have their current best toy taken away from them


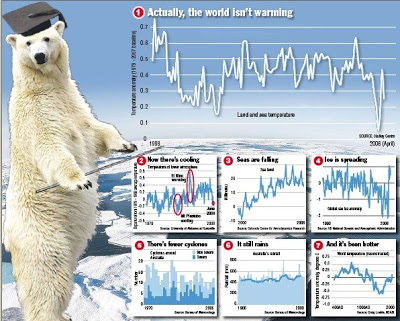
THESE are the seven graphs that should make the Rudd Government feel sick. These are the seven graphs that should make you ask: What? Has global warming now stopped? Look for yourself. They show that the world hasn't warmed for a decade, and has even cooled for several years.
Sea ice now isn't melting, but spreading. The seas have not just stopped rising, but started to fall. Nor is the weather getting wilder. Cyclones, as well as tornadoes and hurricanes, aren't increasing and the rain in Australia hasn't stopped falling. What's more, the slight warming we saw over the century until 1998 still makes the world no hotter today than it was 1000 years ago. In fact, it's even a bit cooler. So, dude, where's my global warming?

These graphs should in fact be good news for the Government and all the other warming preachers who warned we were doomed by our gases, which were heating the world to hell. Now Prime Minister Kevin Rudd can at last stop sweating about the warming terrors he told us were coming - the horrific droughts, the dengue fever, the malaria, the devastation to our land and economy. And he can announce that, hey, emergency over for now. His emissions trading scheme will go into deep freeze while he checks this good news.

As for his promise this week to make your power bills go up $200 a year to stop global warming? His promise to make even food more expensive? To put gassy companies out of business, and their workers out of a job? Cancel all that. As you were, soldier. Good news has come from the front.

But now you can see why these graphs terrify Rudd, who has never admitted to a single fact they contain. You think he dares admit he panicked you for no good reason? Wasted countless millions of dollars?

Yet the facts are stark: The world simply isn't warming as he and his pet scientists said. That's why 31,000 other scientists, including world figures such as physicist Prof Freeman Dyson, atmospheric physicist Prof Richard Lindzen and climate scientist Prof Fred Singer, issued a joint letter last month warning governments not to jump on board the global warming bandwagon. "There is no convincing scientific evidence that human release of carbon dioxide, methane, or other greenhouse gases is causing or will, in the foreseeable future, cause catastrophic heating of the earth's atmosphere and disruption of the earth's climate."

That's why Ivar Glaever, who won a Nobel Prize for Physics, this month declared "I am a sceptic", because "we don't really know what the actual effect on the climate is". And it's why the American Physical Society this month said "there is a considerable presence within the scientific community of people who do not agree with the (Intergovernmental Panel on Climate Change) conclusion that anthropogenic CO2 emissions are very probably likely to be primarily responsible for the global warming that has occurred since the Industrial Revolution."

So let me go through my seven graphs that help to explain why even Nobel Prize winners question what Rudd keeps claiming -- that man is warming the world, and dangerously. The main graph is from the Hadley Centre of Britain's Meteorological Office and one of the four bodies measuring world temperature. As you see, since 1998 -- an unusually warm year thanks to the "El Nino" pool of warmer water in the Pacific -- the world's temperature dropped back to a steady plateau, followed by a few years of cooling.

The second graph confirms both the halt in warming, and then cooling. It's from another of those four bodies, the University of Alabama in Huntsville, which monitors the troposphere -- from the ground to 12km altitude. Only one of the four, in fact, claims temperatures are still rising. That's NASA, whose program is run by Dr James Hanson, Al Gore's global warming adviser and a controversial catastrophist whose team's reworking of data has been heavily criticised for exaggerating any heating.

But before I go on, a caveat: This recent cooling doesn't disprove the theory that man is warming the world. Ten years is too short to be sure of a trend. Natural factors may for now be countering the effect of our gases. Then again, the theory that man has warmed the world is based on a rise in temperature over a period that's not much longer -- from just 1975 to 1998. And the computer climate models that scientists use to predict catastrophic warming a century from now somehow never predicted a cooling that's happening right now. And these are the models Rudd is betting on with our jobs and cash.

The third graph shows another surprise those models never predicted: the seas have stopped rising. The waters have crept up for at least 150 years, since the world started to thaw from the Little Ice Age, and well before any likely man-made warming. But the climate models predicted that a big rise in emissions from all those cars, power plants and factories since World War II would cause an equally big rise in the seas, swelling them as much as 59cm by 2100. This wasn't scary enough for alarmists like Al Gore, though, who claimed whole cities could in fact be drowned under 6m of ocean.

But the satellites that have checked sea levels since 1992 find the seas have instead fallen over the past two years. Again, this could be a blip. But it isn't what the models predicted.

The fourth graph seems to confirm a cooling. Forget media scares about a melting North Pole; sea ice has grown so fast in the southern hemisphere there is now more ice in the world than is usual, says the US National Oceanic and Atmospheric Administration.

Graph five punctures another scare. No, global warming hasn't given us more cyclones - or more tornadoes or hurricanes anywhere. Nor is their proof that cyclones are getting worse, says the American Meteorological Society. And warming hasn't stopped our rain, either, despite media hype about a "one-in-a-100 year drought". See the Bureau of Meteorology records in graph six. It's just bad luck that the fickle rain now tends to fall where it's not needed most.

And, please, can we drop that old fiction that the world was never warmer? It's a false claim made popular by a 2001 report of the IPCC, the United Nations' climate group, which ran a graph, shaped like a hockey stick, claiming there was no warming for millennia until humans last century gassed up their world. In fact, that "hockey stick" is now discredited, and last year Dr Craig Loehle, of the US National Council for Air and Stream Improvement, argued that using tree rings to work out past temperatures was clearly unreliable. He instead produced a graph - No. 7 - of past temperatures using all other accepted proxies.

You see his results (which for statistical reasons stop at 1935): they show humans lived through a medieval period that was warmer than even today. This was a period that historical accounts confirm was so warm that Greenland farmers grew crops on land now under snow, and British ones grew grapes.

But I repeat: the world may yet warm again, and soon, although scientists at Leibnitz Institute and Max Planck Institute last month predicted it won't for at least another decade. If at all, say solar experts worried by a lack of sun spots.

But even if none of my graphs disproves the theory that man is causing dangerous warming, they should at least make you pause. They should at least make you open to other theories of climate change, like that of Dr Henrik Svensmark, head of Denmark's Centre for Sun-Climate Research, who thinks changes in cosmic rays, which affect clouds, may explain much of the recent warming. And now the cooling, too.

But, above all, when that man with the sandwich board comes tugging at your sleeve again, shouting, "Quick, help me save the world - or die", hang on to your wallet, friend. Give that urger my seven graphs instead, and ask him how many more years of no warming will it take before he admits it really is too soon to panic.

Source

Correcting the surface temperature record for UHI

26 09 2009 As we’ve seen in this report from John Goetz, GISS: worlds airports continue to run warmer than ROW a significant portion of the GHCN (Global Historical Climate Network) surface temperature record is measured in airports, not rural open fields. Airports, airport expansion, and air travel frequency tend to be linked with the population, growth, and wealth trends of a city. It stands to reason that since the majority of thermometers in the GHCN record are at airports, they’d have a broad application of UHI. Joe tries out a simple method of approximating what the signal might look like with a UHI removal. – Anthony
Chasing a More Accurate Global Century Scale Temperature Trend
By Joseph D’Aleo, CCM, AMS Fellow
image
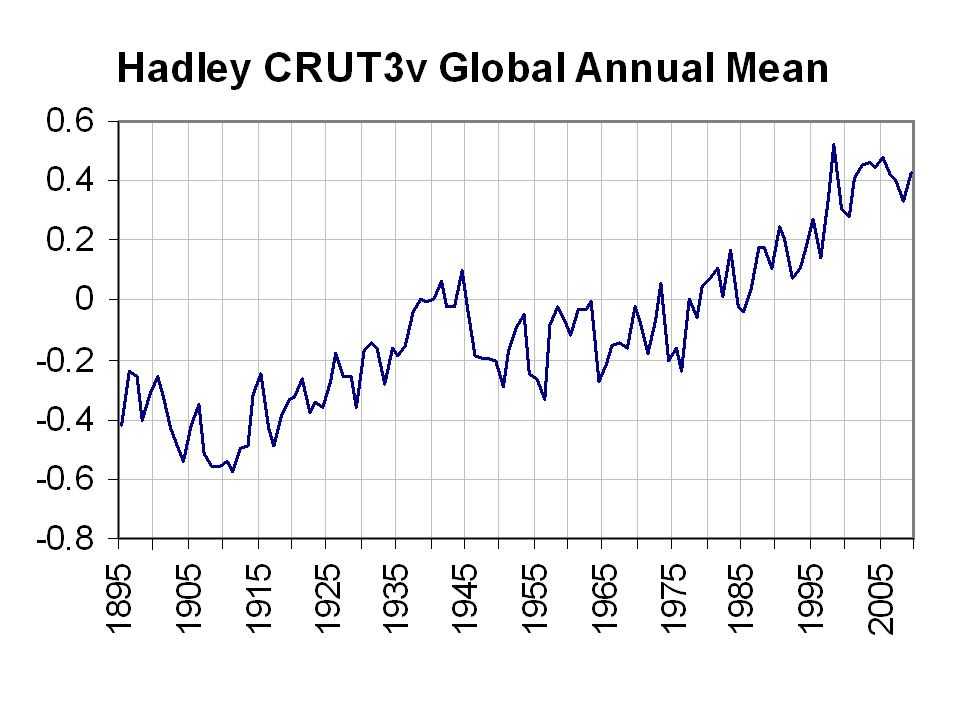
Hadley Center Annual Mean Temperature since 1895 shows a warming of about 1C since 1895. – Click for larger image
The long term global temperature trends have been shown by numerous peer review papers to be exaggerated by 30%, 50% and in some cases much more by issues such as urbanization, land use changes, bad siting, bad instrumentation, and ocean measurement techniques that changed over time. NOAA made matters worse by removing the satellite ocean temperature measurement which provide more complete coverage and was not subject to the local issues except near the coastlines and islands. The result has been the absurd and bogus claims by NOAA and the alarmists that we are in the warmest decade in 100 or even a 1000 years or more and our oceans are warmest ever. See this earlier story that summarizes the issues.
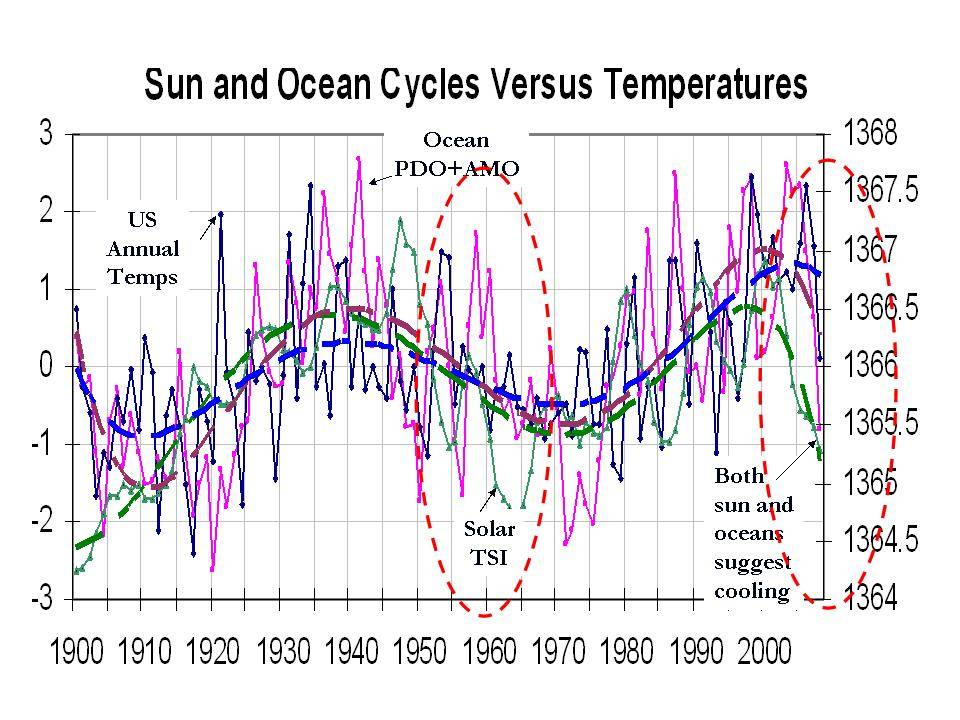
No one disputes the cyclical warming from 1979 to 1998 that is shown in all the data sets including the satellite, only the cause. These 60-70 year cycles tie in lock step with the ocean temperature cycles and solar Total Solar Irradiance. The annual mean USHCN temperatures are shown below along with the annual TSI and PDO+AMO.
image Click for larger image
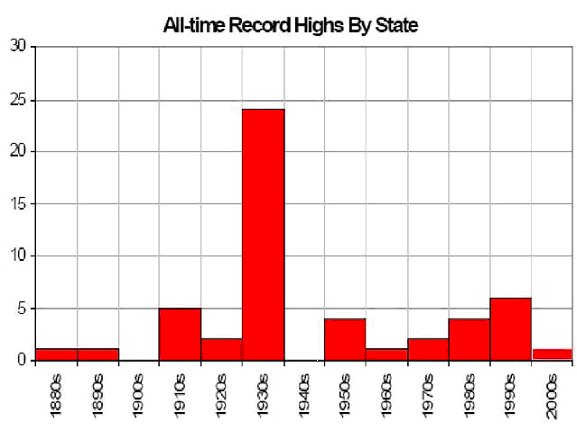
One needs simply to look at the record highs for the United States and globe to see that the warmest years are not all in the last two decades (although some were to be expected given it is one of two peaks in the cycles). The first image below shows the decadal state record all-time highs. The 1930s still clearly dominates (24 state all time records) with only one state (South Dakota) in the 2000s tying a 1930s all-time heat record.
image Click for a larger image
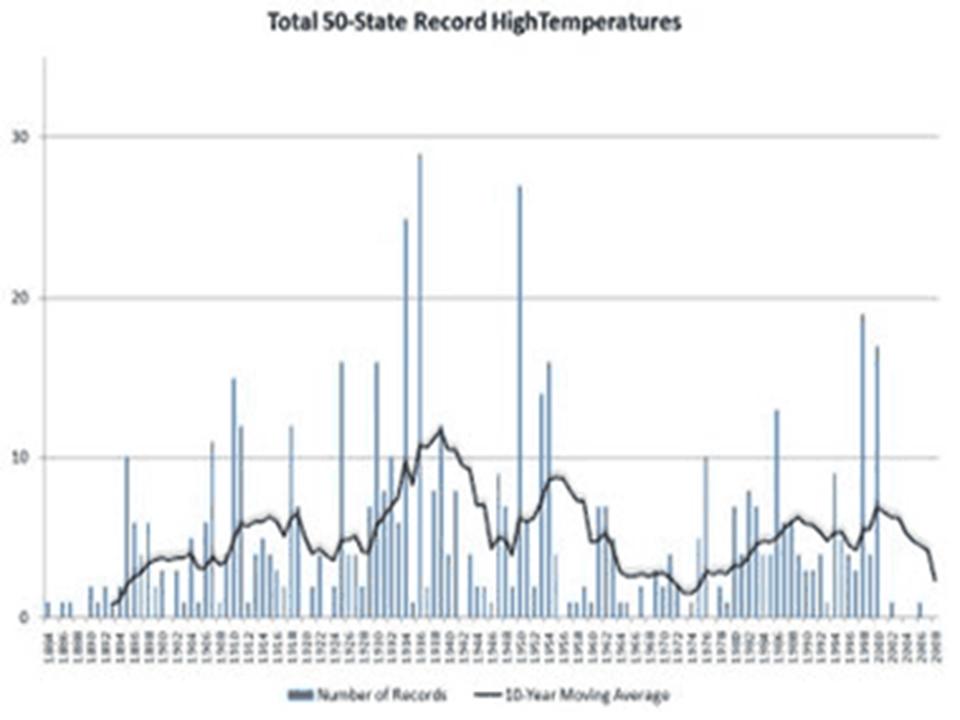
The following image (enlarged here) shows the record monthly highs by individual year. Note the 1930s and 1950s dominate and this decade showing the least record highs than any decade since the 1800s.
image
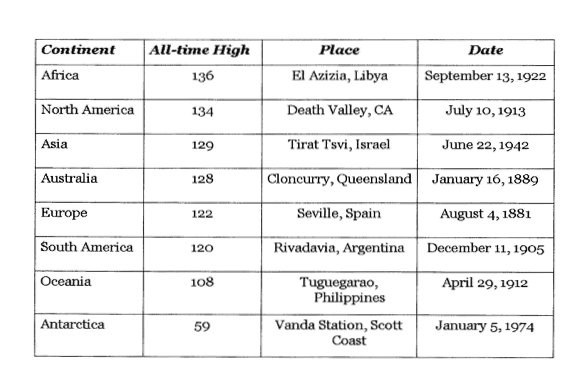
Here is the NCDC compilation of the continental all-time records (enlarged here), note for all the populated continents, the records were in the 1800s and early 1900s.
image
TRYING TO GET AT A BETTER LONG TERM TREND
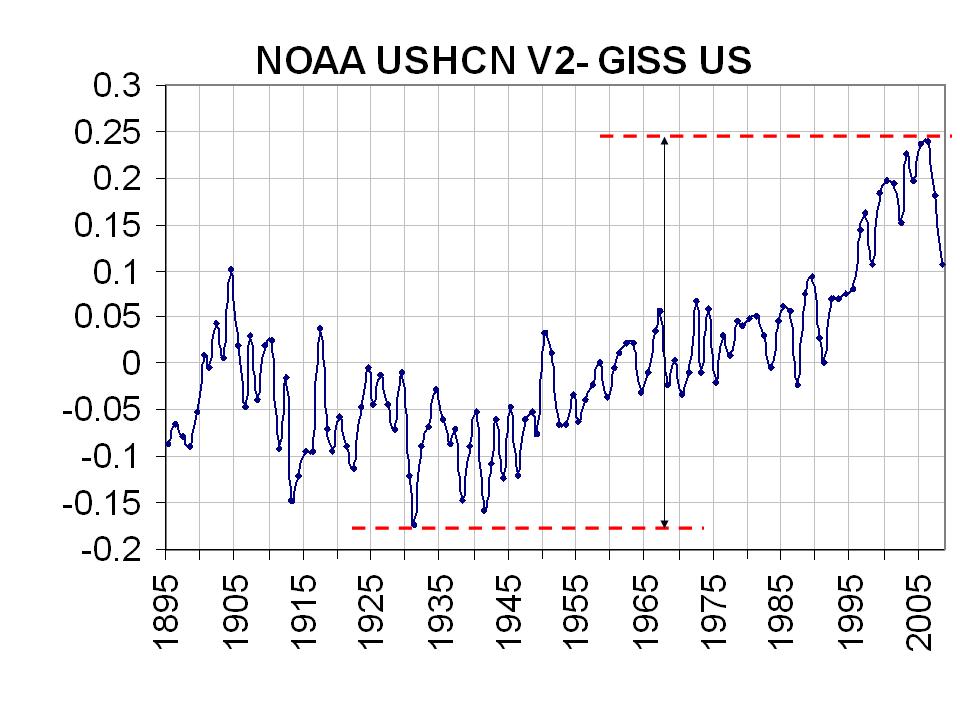
NCDC removed the UHI effect for the US in 2007 in version 2 of the USHCN. GISS maintains their version of a UHI adjustment of this NCDC USHCN data. By differencing the two, I found the following (enlarged here):
image NOAA USHCNV2 -vs- GISS – click for larger image
It shows an artificial warming of about 0.45 C or 0.75F for the NOAA data for removal of the urbanization adjustment. Phil Jones of the Hadley Center, co-authored a paper that showed the UHI contamination of China was 1 degree Celsius (1.8F) for the century, so this contamination appears not to be unreasonable, in fact it may be conservative.
I then took that UHI adjustment for the United States and applied to the global data. The Hadley center data is dominated by land areas with their ocean temperatures mainly coming from ships and in the northern hemisphere. Here’s what Hadley says about marine data “For marine regions sea surface temperature (SST) measurements taken on board merchant and some naval vessels are used. As the majority come from the voluntary observing fleet, coverage is reduced away from the main shipping lanes and is minimal over the Southern Oceans.”
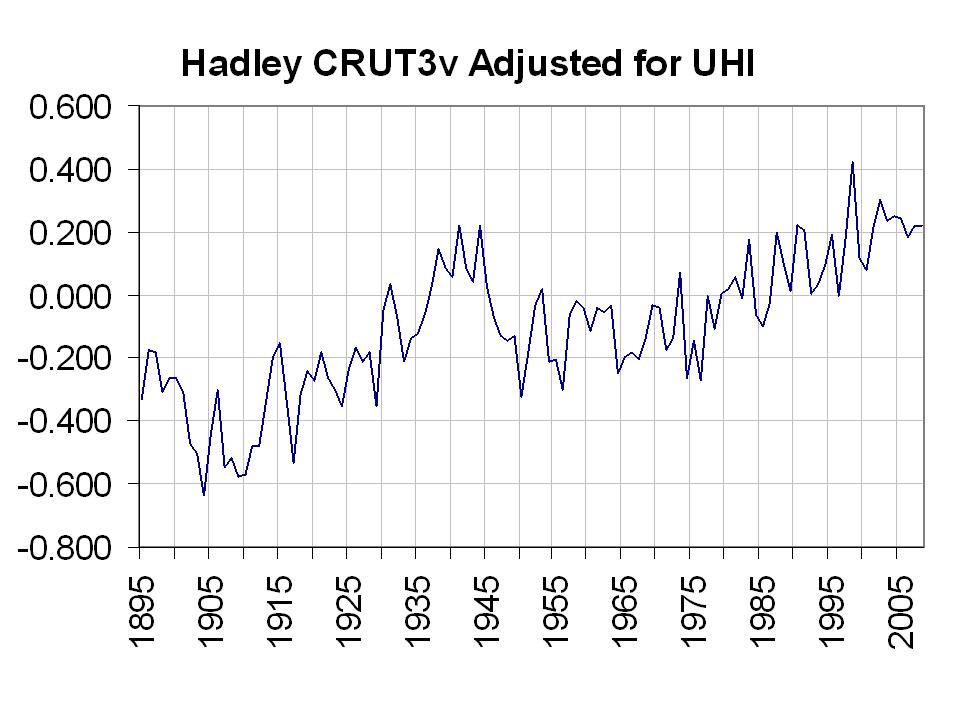
I subtracted the UHI annual contamination from the annual Hadley CRUT3v global temperatures. I got the following (enlarged here):
image
This gives a much more believable view of global temperatures, consistent with the natural forcings and more in line with records shown. The greatest warming was in the early 20th Century. The warming since 1930s and 1940s was negligible (0.2C). It suggests much to do about nothing in DC and Copenhagen. See PDF here.
UPDATE: This post has been changed to include a raw Hadley CRUT3v global plot, a NOAA-GISS difference plot and a corrected adjusted Hadley plot now all in Celsius. This is a work in progress and an attempt to see what Hadley plot might look like with an adjustment for UHI that numerous peer review papers suggest is necessary. Your suggestions are welcome (jsdaleo at yahoo.com).


Global warming? Look at the numbers

In his enviro-propaganda flick, An Inconvenient Truth, Al Gore claims nine of the 10 hottest years on record have occurred in the last decade. That's been a common refrain for environmentalists, too, and one of the centrepieces of global warming hysteria: It's been really hot lately -- abnormally hot -- so we all need to be afraid, very afraid. The trouble is, it's no longer true.

In his enviro-propaganda flick, An Inconvenient Truth, Al Gore claims nine of the 10 hottest years on record have occurred in the last decade. That's been a common refrain for environmentalists, too, and one of the centrepieces of global warming hysteria: It's been really hot lately -- abnormally hot -- so we all need to be afraid, very afraid. The trouble is, it's no longer true.
Last week, NASA's Goddard Institute for Space Studies -- whose temperature records are a key component of the global-warming claim (and whose director, James Hansen, is a sort of godfather of global-warming alarmism) -- quietly corrected an error in its data set that had made recent temperatures seem warmer than they really were.
A little less than a decade ago, the U.S. government changed the way it recorded temperatures. No one thought to correlate the new temperatures with the old ones, though -- no one until Canadian researcher Steve McIntyre, that is.
McIntyre has become the bane of many warmers' religious-like belief in climate catastrophe. In 2003, along with economist Ross McKitrick, McIntyre demolished the Mann "hockey stick" --a graph that showed stable temperatures for 1,000 years, then shooting up dangerously in the last half of the 20th Century.
The graph was used prominently by the UN and nearly every major eco lobby. But McIntyre and McKitrick demonstrated it was based on incomplete and inaccurate data.
To NASA's credit, when McIntyre pointed out their temperature errors they quickly made corrections.
Still, the pro-warmers who dominate the Goddard Institute almost certainly recognized the impacts these changes would have on the global-warming debate, because they made no formal announcement of their recalculations.
In many cases, the changes are statistically minor, but their potential impact on the rhetoric surrounding global warming is huge.
The hottest year since 1880 becomes 1934 instead of 1998, which is now just second; 1921 is third.
Four of the 10 hottest years were in the 1930s, only three in the past decade. Claiming that man-made carbon dioxide has caused the natural disasters of recent years makes as much sense as claiming fossil-fuel burning caused the Great Depression.
The 15 hottest years since 1880 are spread over seven decades. Eight occurred before atmospheric carbon dioxide began its recent rise; seven occurred afterwards.
In other words, there is no discernible trend, no obvious warming of late.
Ever since the correction became a hot topic on blogs, the pro-warmers have tried to downplay its significance, insisting, for example, that the alterations merely amount to "very minor rearrangements in the various rankings."
It's true the changes aren't dramatic. But the optics are.
Imagine if the shoe were on the other foot. Imagine the shrieking of the warmers if we had previously thought that hot years were scattered throughout the past 130 years, but after a correction the warmest years could be seen to be concentrated in the past decade.
They would insist the revised data proved their case. They would blitz every news organization and talk show. They would demand to be allowed to indoctrinate school children on the evils of cars and factories.
So they shouldn't be permitted to brush aside this new data, which makes their claims harder to prove.
Ten years ago, warmers found a similarly small error in the temperature data collected by weather satellites. The satellites were a thorn in their sides because while the warmers were insisting the Earth was getting hotter, the satellites showed it was in fact cooling ever so slightly.
Then the warmers discovered that the scientists who maintained the orbiting thermometers had failed to account for orbital decay, the almost infinitesimally small downward drift of the "birds" every year.
When the effects of drift were added into the observations, the cooling was found to be just 0.01 degree per decade rather than the 0.04 degrees previously claimed.
On this basis, the warmers now insisted then that even the satellites were somehow in agreement with their theory.
Of course, the current NASA changes are only for data collected in the United States. But available surface temperature readings cover only half the planet even today. Before the Second World War, they covered less than a quarter. So U.S. readings for a period that goes as far back as 1880 are among the most reliable there are.
Perhaps we will have uncontrollable warming in the future, but it likely hasn't started yet.
[email protected]

NASA: 1934 Hottest Year on Record


NASA scientists this month corrected an error that resulted in 1934 replacing 1998 as the warmest year on record in the U.S., thus challenging some key global warming arguments, but the correction is being ignored, a conservative climate expert charged Wednesday.

Yet at the same time, announcements that support global warming are considered "front-page news," said H. Sterling Burnett, a senior fellow at the conservative National Center for Policy Analysis (NCPA).

For his part, James Hansen, director of NASA's Goddard Institute for Space Studies, has called the correction is "statistically insignificant."

Burnett challenged that assertion, saying the correction made it clear that NASA's conclusion -- that the majority of the 10 hottest years have occurred since 1990 -- is false.

"Time after time, Hansen and other global warming alarmists present their data as 'the facts,' and [say that] 'you can't argue with data,' " he said. "Well, it turns out their data is just wrong. And when it's wrong, they want to say it's not important."

The controversy began on Aug. 4, when blogger Steve McIntyre of the ClimateAudit.org website, sent an email to NASA asserting that the data collected by the agency after 1999 was not being adjusted to allow for the times of day when readings were taken or the locations of the monitoring stations.

According to a blog posting by NASA climate modeler Gavin Schmidt, agency analysts then "looked into it and found that this coincided with the switch between two sources of U.S. temperature data."

"There had been a faulty assumption that these two sources matched," Schmidt said. "The obvious fix was to make an adjustment based on a period of overlap so that these offsets disappear."

Schmidt said the data analysis was then adjusted accordingly, and a note of thanks emailed to McIntyre.

"The net effect of the change was to reduce mean U.S. anomalies by about 0.15 degrees Celsius for the years 2000-2006," which resulted in a "very minor knock" on information from earlier years, Schmidt added.

Burnett, however, called the miscalculation "a serious math error" and noted that according to NASA's newly published data:
  • The hottest year on record is 1934, not 1998;
  • The third hottest year on record was 1921, not 2006;
  • Three of the five hottest years on record occurred before 1940; and
  • Six of the top 10 hottest years occurred prior to 90 percent of the growth in greenhouse gas emissions during the last century.
'Ignore the man behind the curtain'

The NCPA analyst also charged that because the change does not fit the mainstream media's view of global warming as an immediate and ongoing crisis, the incident was being ignored by television news networks and newspapers across the country.

Cybercast News Service conducted a Nexis search for news articles over the past month containing the words "NASA," "1998" and "1934." As of Tuesday, Aug. 14, only eight newspapers had discussed the correction, along with United Press International (UPI) and the Fox News Channel.

On Wednesday, however, a dozen major news outlets -- ranging from the Chicago Sun-Times and Tribune to the Los Angeles Times and CNN -- finally ran stories on the change, most emphasizing the resulting controversy that had erupted across the conservative blogosphere.

In the Washington Post, Hansen said that the critics were "making a mountain of a molehill. The change does nothing to our understanding of how the global climate is changing and is being used by critics to muddy the debate."

"Hansen said that NASA generally does not release or discuss national weather statistics because it is more concerned with global patterns," the Post reported. "The agency that pays more attention to American temperature trends is the National Oceanic and Atmospheric Administration, which has said that most of the warmest years in the past century have been in the past 12 years."

"Hansen said the revised data do nothing to change that overall trend," the newspaper added.

Burnett was highly critical of the Washington Post's coverage of the story.

"The Post gave James Hansen -- the one who made the error -- four paragraphs to tell you why it's not important and why it should be ignored," he stated. "Hansen basically said, 'I screwed up, but just ignore the man behind the curtain,' and they let him get away with it."

Burnett also dismissed the idea that the change is "statistically insignificant" because the numbers concerned were so small.

"A few years back, an error in satellite data was found and corrected from 0.04 degrees of cooling per decade to 0.01 degrees, and that was front-page news," he said. "If a change of 0.03 degrees is significant, then what about this, which is five times more? If the one is important for making your case, then the other is important for undermining your case.

"What's really important is not that it shows whether it's warming or not -- because it doesn't," Burnett stated. "But we've supposedly got the best data in the world, and we're relying on data from a lot of places where they're not checking it nearly as closely as our guys."

As for NASA, Burnett charged that "they need mathematicians on their staff, not climatologists. What does it say when we had to have a blogger go in there and discover their error?"
posted by Jeff Samano | 1:04 AM


- Obama Regime Scientists Fiddle With Climate Data To Erase The 15 Yr Global Warming Hiatus
From the Daily Caller: National Oceanic and Atmospheric Administration scientists have found a solution to the 15-year “pause” in global warming: They “adjusted” the hiatus in warming out of the temperature record. New climate data by NOAA...

- The Fiddling With Temperature Data Is The Biggest Science Scandal Ever
From the Telegraph: When future generations look back on the global-warming scare of the past 30 years, nothing will shock them more than the extent to which the official temperature records – on which the entire panic ultimately rested – were systematically...

- Lord Monckton On Climategate: "they Are Criminals"
From Pajamas Media: This is what they did — these climate “scientists” on whose unsupported word the world’s classe politique proposes to set up an unelected global government this December in Copenhagen, with vast and unprecedented powers to...

- The Concept Of Man-made Global Warming Is Designed To Destroy Western Civilization
... JUST AS SURE AT JIHADISM IS DESIGNED TO DESTROY INFIDELS. All of you, do yourselves a favor, and stop believing in this Leftist bullshit. 1998 no longer the hottest year on record in USAHere's a story of scientific investigation and discovery...

- Massive Scientific Fraud: Blatant And Grossly Deceptive Data Selection ("cherrypicking") By Warmist "scientists"
Clearly, this blog has nothing, or next to nothing, to do with Global Warming. The only reason the topic ever comes up is because I believe Global Warming is used as a way for the Left to hammer at Capitalism, which in turn softens our strength of resolve...


Green Energy


.